
Introduction
In the complex world of finance and business, accurate and transparent reporting of financial information is crucial. To ensure consistency and reliability, organizations adhere to reporting standards, which consist of guidelines and principles governing the presentation of financial and non-financial information. This post explores the significance of reporting standards, including the International Financial Reporting Standards (IFRS), along with key tips for standardizing your existing reports.
Importance of Reporting Standards in 6 Steps
- Consistency and Comparability: Reporting standards ensure consistent and comparable presentation of financial information, allowing stakeholders to make meaningful comparisons between organizations, industries, and regions. This fosters confidence in the accuracy and reliability of financial data.
- Transparency and Accountability: Reporting standards promote transparency by compelling organizations to disclose relevant and reliable information. Stakeholders gain access to comprehensive data about an organization’s financial position, performance, and risks, facilitating informed decision-making and holding companies accountable.
- Improved Decision-Making: Standardized reporting enables accurate analysis, leading to better decision-making. Stakeholders can confidently assess an organization’s financial health, profitability, and sustainability, enabling investors, creditors, and managers to make informed choices based on reliable data.
- Regulatory Compliance: Reporting standards mandated by regulatory bodies ensure legal compliance and uniformity in reporting practices. Adherence to widely adopted standards like International Financial Reporting Standards (IFRS) enhances credibility, avoids legal issues, and protects the interests of stakeholders.
- Investor Confidence and Access to Capital: By adhering to reporting standards, organizations build investor confidence. Standardized financial reporting fosters trust, and credibility, and improves an organization’s perception, making it more attractive to investors and increasing access to capital markets for growth and expansion.
- Integrated Reporting: Integrated Reporting combines financial and non-financial information, providing a holistic view of an organization’s value creation, strategy, and performance. It goes beyond traditional financial reporting by considering environmental, social, and governance (ESG) factors. Integrated Reporting enhances transparency and accountability, providing stakeholders with a comprehensive understanding of an organization’s long-term sustainability and societal impact.
How to Standardise Your Report
Standardizing existing reports can bring several benefits, such as improved clarity, consistency, and efficiency.
1. Identification of Common Elements:
Begin by conducting a thorough examination of your current reports to identify recurring elements like headers, footers, and formatting styles. This initial step will provide a solid basis for the standardization process.
2. Develop a Report Template:
Developing a report template involves creating a standardized framework that encompasses the purpose, structure, and design of the report. The first step is to define the purpose and scope of the template, identifying the types of reports it will be used for. Next, determine the structure and sections of the template, customizing them to suit your organization’s specific needs. Design the layout of the template, considering factors such as font styles, sizes, spacing, and margins, ensuring consistency throughout. Additionally, incorporate relevant visual elements, such as graphs, charts, or tables, to enhance data visualization. By developing a well-designed report template, you can establish consistency and efficiency in your reporting processes, making it easier to create professional and informative reports.
3. Establish a Style Guide: Develop a style guide that outlines guidelines for formatting, language usage, and visual elements. This guide will ensure consistency in writing style, terminology, and graphical representations across reports.
4. Define Clear Objectives and Key Metrics: Defining clear objectives and key metrics is crucial for effective reporting. Start by understanding the purpose of your reports and the specific information needs of your audience. Determine the questions you want to address or decisions you aim to support. Then, identify key metrics aligned with your objectives. Choose quantitative and qualitative metrics that reflect performance or impact. For instance, if assessing sales performance, consider revenue, units sold, conversion rates, or customer satisfaction. Select metrics that are specific, measurable, attainable, relevant, and time-bound (SMART). By defining clear objectives and key metrics, you provide valuable insights for decision-making and drive performance improvements in your reports.
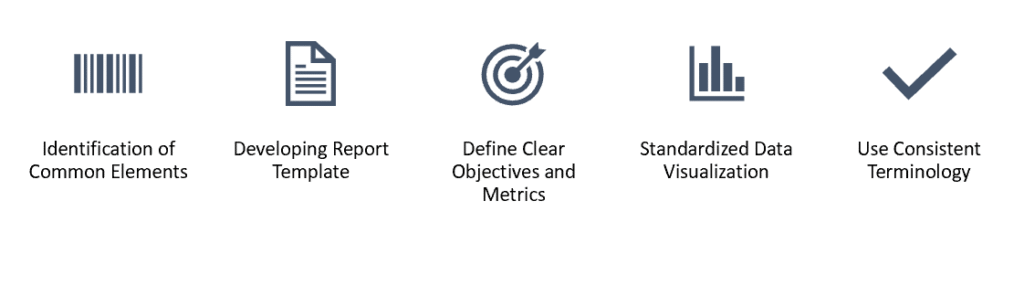
5. Create Standardized Data Visualization: Creating standardized data visualizations involves a systematic approach to ensure consistency and effectiveness in presenting the information. Begin by thoroughly understanding the data and the context in which it will be presented. Identify the key variables, relationships, or patterns that you want to highlight in the visualization. Next, choose the most suitable visualization type that aligns with your data and intended insights, considering the strengths and limitations of each option. Once you have selected the visualization type, establish standardized design elements such as colors, fonts, labels, and legends. Consistently apply these design elements across all visualizations to maintain a cohesive and professional appearance. Additionally, strive for clarity and simplicity in your visualizations by avoiding clutter and unnecessary complexity. Use clear titles, axis labels, and annotations to provide context and aid understanding. Finally, regularly review and refine your standardized data visualizations to enhance their clarity and effectiveness in communicating insights to your audience.
After these standardization steps, ensure consistent terminology by using the same terms throughout the reports and maintaining a glossary. Second, establish a review process to conduct quality checks and address any inconsistencies or errors. Third, provide training and guidelines to report authors to promote adherence to standardized practices. Lastly, seek feedback from report users and stakeholders to identify areas for improvement and continuously refine your reporting processes. By implementing these tips, you can enhance consistency, accuracy, and effectiveness in your reports.
In conclusion, Reporting standards serve as a cornerstone for transparent financial reporting, enabling consistency, comparability, transparency, and accountability. They provide a framework for organizations to present financial information in a standardized manner, promoting informed decision-making and building investor confidence. By complying with reporting standards, companies contribute to a trustworthy financial ecosystem that drives economic stability and facilitates the allocation of resources. Additionally, the emergence of Integrated Reporting further enhances transparency by considering a broader range of factors beyond financial metrics.
If you’re looking for business intelligence software that offers powerful value driver tree functionality, then SAP Analytics Cloud might be a choice for you.
If you want to get more information to see if SAP Analytics Cloud is suitable for your requirements we are happy to provide you more insights with a live demonstration.