
Introduction
Previously, we discussed the smart prediction capabilities of SAP SAC, starting with the classification feature and exploring its details through various use cases. In this edition of our newsletter, we’ll be diving into the Regression feature of smart prediction in SAP SAC. We’ll optimize the model using the Bank Customer Churn dataset, the same one we used before, to demonstrate its effectiveness in real-world scenarios.
What is Regression?
Regression analysis is one of the approaches used to model and analyze numerical data, where you have a target variable and one or more predictor variables. The regression parameters are estimated to find the “best fit” for the data.
In a regression equation, the target variable is expressed as a function of the predictor variables, a constant, and an error term. The target variable is continuous.
Note: Check this newsletter to refresh your memory about this data source.
Business Scenario
To use the Bank Customer Churn dataset for regression analysis, we need to select a target variable that is continuous. Based on the dataset’s typical structure, here are some continuous variables that could serve as potential targets for regression:
- Credit Score: Represents the creditworthiness of a customer, often ranging from 300 to 850.
- Balance: Indicates the account balance of the customer, typically a continuous value.
- Estimated Salary: Reflects the customer’s annual income, usually reported as a continuous figure.
- Age: While it’s a discrete value, age can be treated as continuous for certain regression models, particularly when predicting trends over time.
- Tenure: The number of years a customer has been with the bank, which can be considered continuous for predictive analysis.
These variables can be explored further depending on the specific business question or prediction goals in your regression analysis.
We can examine the relationships between these variables and other features to develop predictive models. For instance, in one use case, we’ve chosen the ‘Credit Score’ column as the target variable. The goal of this use case is to predict a customer’s credit score based on features such as country, gender, age, tenure, balance, number of products, credit card status, active member status, and estimated salary.
Subsequently, we will compare the results of different models to gain deeper insights into customer behaviour patterns.
NOTE: customerID column or any unique identifier should not be included in the column in your regression model. It has no meaningful relationship with the estimated_salary or any other feature in your dataset. Including it as a feature would not provide any predictive power and could introduce noise into your model.
Now, let’s begin to create a regression scenario in SAP SAC.
Firstly, choose regression in predictive scenarios application.

Next, we need to select our training data source, which in this case is ‘Churn_Modelling_train.’ Our predictive goal is to forecast the ‘Credit Score.’ In the initial step, only the ‘row_number’ column is excluded from the analysis. As we progress, we will experiment with additional models to explore the dataset’s features and their impact on accuracy.
Now, click on ‘Train.’ Training is the process where SAC Smart Predict uses machine learning algorithms to analyze relationships within your data and identify the optimal combinations for building a predictive model.
After receiving the model results, I adjusted the influencer parameters by excluding some features that did not significantly affect the outcome. As mentioned earlier, unique columns were also excluded, bringing the total number of excluded columns to seven.
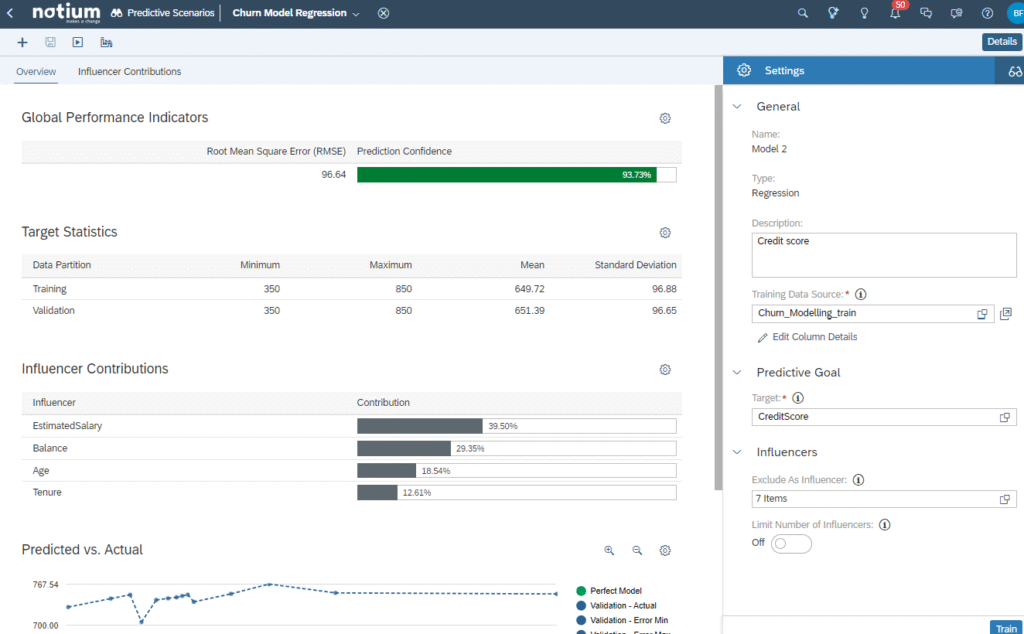
Prediction Confidence measures how reliably the predictive model can make accurate predictions when new data is introduced. In our model, the prediction confidence is 96.6%, indicating near-perfect reliability. The target statistics provide insights into the minimum, maximum, mean, and standard deviation for both the training and validation datasets.
During training, Smart Predict identifies an optimized set of influencers to include in the predictive model. Influencers are the variables that significantly impact the target variable.
Below is the model accuracy result.
On behalf of prediction confidence, RMSE is an important evaluation parameter for regression. Root Mean Squared Error(RMSE), is a standard way to measure the accuracy of a regression model. It quantifies the difference between predicted values generated by the model and the actual values observed in the data.
- Lower RMSE: Indicates a better fit of the model to the data, meaning the model’s predictions are close to the actual values.
- Higher RMSE: Suggests a poorer fit, with larger differences between predicted and actual values.
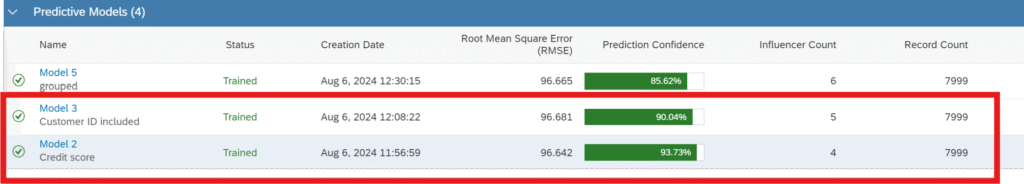
As shown above, despite RMSE being quite the same, prediction confidence is higher since we exclude customer_id.
Further Analysis
Out of curiosity, I decided to train the pre-processed data source we structured earlier. By incorporating the age group column, we can explore credit score prediction further and extract additional insights.
After following similar workflows, here are all the results. Now it’s time to choose the best model to predict our test data.
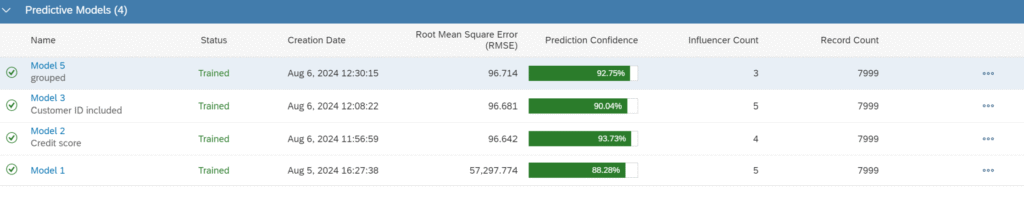
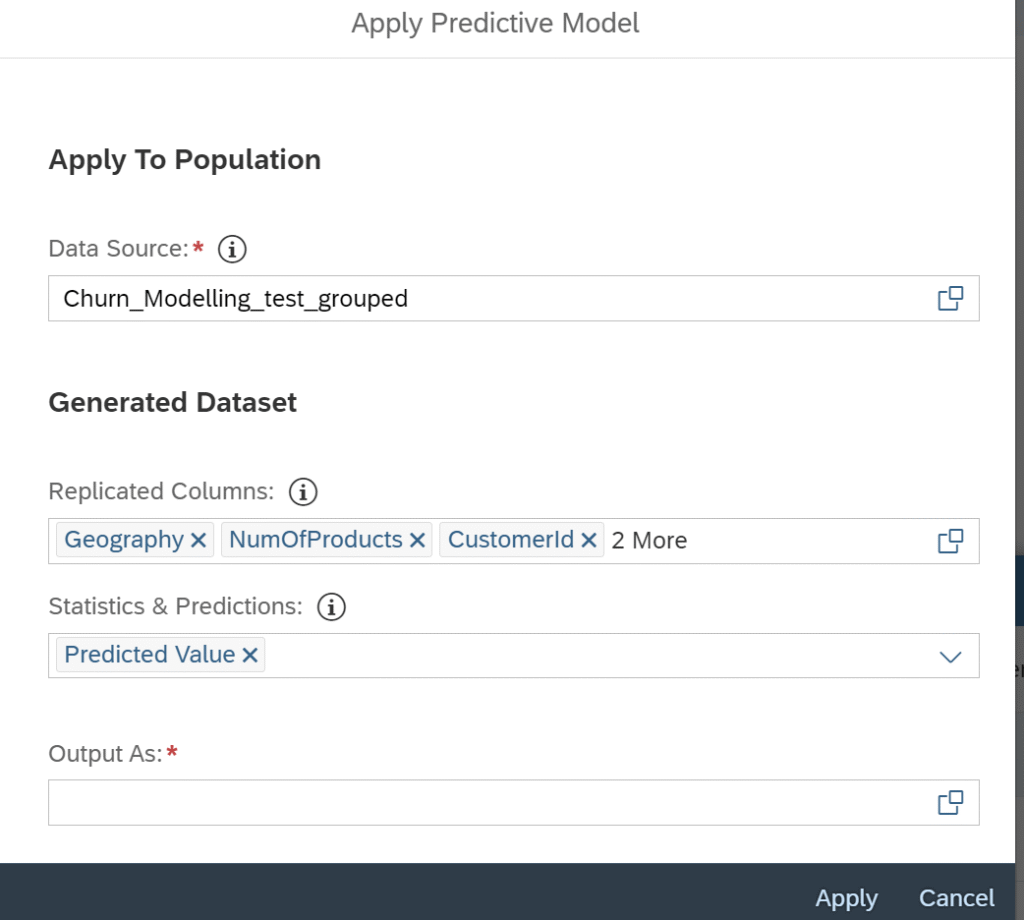
Although the results are quite similar for both RMSE and Prediction Confidence, I chose to go with the last model, which has the highest RMSE, for predicting the test data. A closer look at the numbers confirms that Model 5 will be the ideal predictive model to achieve better results. I also added additional columns, such as geography and customerId, to the output file for a more comprehensive analysis.
Conclusion
Hence our regression predictive model has predicted the credit score of Bank Churn Pattern dataset with predictive confidence and RMSE of 96.714% and 92.75% respectively. Additionally, the newsletter guides you in understanding regression predictive scenarios in SAP Analytics Cloud with a practical use case, and feature engineering approach. SAP SAC offers a user-friendly interface even for complex prediction scenarios. Apart from regression, it also provides tools for time-series analysis, which we’ll cover in our upcoming newsletter.