Before going into details about data storytelling and why it is crucial, there are some fun facts about data which will show us what we are dealing with.
• The total amount of data being captured and stored by the industry doubles every 1.2 years;
• And, my favourite one – If you burned all of the data created in just one day onto DVDs, you could stack them on top of each other and reach the moon – twice.
Some are not as interesting as those above, but they are critical to understanding why exposing more from a dataset is important.
• Bad data costs businesses alone more than $600 billion annually;
• 70% of data is created by individuals, but enterprises are responsible for storing and managing 80% of that.
From startups to established businesses are relying on tools and technology to collect, store, and analyse data more than ever before. Today many industry leaders use a technique known as data storytelling to accomplish this.
The next step is to extract value from the data after being collected and cleansed. Extracting meaningful insights to make better business decisions remains a challenge for many organisations, even with extensive BI and analytics tools.
Furthermore, many businesses must not only extract value from raw data but also communicate those insights to clients effectively. Because many clients may lack technical data science expertise, these insights must be communicated in a professional yet understandable manner.
Although it may appear that telling a compelling data story is simple, many marketers and data analysts struggle to use an engaging tone and create a narrative in their reporting. Most businesses, however, tend to overlook this aspect of reporting.
Data analytics and communication are critical components in building reporting standards, as we’ll discuss in this article. However, if you don’t combine your insights with a story that conveys the significance of the data, you won’t be able to provide much value to the users. Data storytelling is a crucial skill for any company looking to increase transparency and improve communication.
What is “Data Storytelling”?
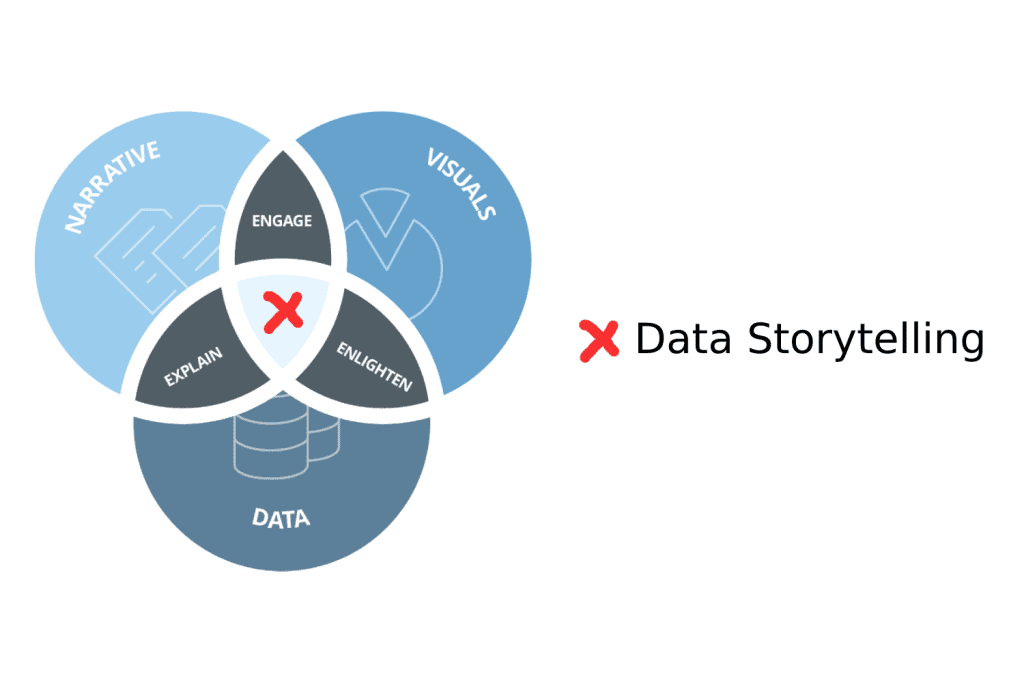
Data storytelling is analysing raw data and conveying its significance to the report’s audience. This is achieved with the aid of the following three essential elements:
-
Data:
The first element of storytelling is having accurate and reliable data. One of the main advantages of an all-in-one reporting platform is that data is automatically pulled from multiple data sources and platforms, which saves time and eliminates the possibility of human error during data collection. Once the data has been gathered and cleansed, it is analysed using statistics and algorithms to extract key insights.
-
Translate:
Utilising graphs, charts, and other visual elements to convey information, data visualisation is a graphical representation of data. Discovering and communicating a dataset’s underlying trends, patterns, and outliers requires the use of data visualisation tools. In the end, the purpose of data visualisation is to uncover trends that may have been missed using a standard spreadsheet and to communicate this information in an understandable manner.
-
Transform:
Lastly, analysts can highlight the significance of particular metrics, KPIs, or changes that may have occurred during the reporting period by incorporating a narrative alongside insights and visualisation. This is the opportunity to demonstrate what is happening and provide unique insights into why and how you intend to make the data actionable.
By incorporating these three elements into your reporting style, you can establish trust and transparency by communicating results in a manner that anyone, regardless of technical expertise, can comprehend.
Six Methods for Including Data Storytelling in Reports
Data storytelling is analysing raw data and conveying its significance to the report’s audience. This is achieved with the aid of the following three essential elements:
- Find the most important data points in your report first. Start by identifying the most crucial data points in your dataset. This will assist you in concentrating on the most vital information and ensuring that it is included in your data narrative.
- Create an accompanying narrative for the data points. Create a narrative to accompany your key data points once you have collected them. This can help to make the data more engaging and understandable to your audience.
- Utilise charts and images to clarify the data. Graphs and visuals can facilitate a more effective explanation of the data. This will aid your audience in comprehending the data you are presenting.
- Utilise images and videos to illustrate your data points. So it can effectively communicate the significance of the data through images – texts – or bullets that go beyond charts and graphs to reveal the underlying data.
- Create a headline that captures the essence of your data-driven narrative. Like any other type of story, a data story requires a captivating headline. The headline should capture the nature of your data narrative and entice readers.
- Use key insights to summarise your data narrative. Include key learnings at the conclusion of your data narrative. This will aid your clients in remembering the most crucial points of your data narrative.
Data storytelling is an excellent method for enhancing your company’s data visualisation skills and understanding. By telling data-driven stories, you can demonstrate not only what is happening with your company (and why), but also it is a direct and clean way to convey your message to your audience without further analysis.
Some links to utilise data storytelling on SAP BI Tools
Link 1
Link 2