In the retail world, speed isn’t just an advantage; it is survival. Prices shift instantly, a single promotion can wipe out stock in minutes, and consumer demand changes like the wind.
We recently partnered with a major multi-channel retailer managing thousands of SKUs across physical stores and digital platforms. They were generating massive amounts of data every single day. However, they faced a significant problem: They were data-rich, yet insight-poor.
Commercial, Operations, and Finance teams relied on data to protect margins and manage inventory. Unfortunately, their reporting tools could not keep up with the frantic pace of modern retail.
Here is the story of how we turned that mountain of data into simple, actionable decisions.
The Problem: Driving with the Rearview Mirror
Our client’s struggle is a familiar one in the industry. They had a robust data foundation (SAP BusinessObjects), but their workflow was painfully manual:
- Pull a retrospective report.
- Dump the data into Excel.
- Spend hours manually crunching numbers.
- By the time an insight was found, the market had already moved on.
Essentially, the teams were trying to navigate the future by looking in the rearview mirror. Which store is underperforming? Did that promotion actually work? Answering these questions took so long that by the time they knew the answer, it was often too late to fix the problem.
The Solution: Evolution, Not Just Revolution
A common mistake in digital transformation is the urge to “rip and replace,” which often means scrapping everything to start from zero. We chose a smarter, more balanced path: A Hybrid Architecture.
Our goal was to modernize their speed to insight without breaking their existing governance structures.
- The Anchor: We kept SAP BusinessObjects for standardized, operational reporting. This preserved the “single source of truth” and corporate governance.
- The Accelerator: We introduced Microsoft Power BI as the interactive layer for speed, visual discovery, and ad-hoc analysis.
This gave them the best of both worlds: the reliability of a legacy system combined with the agility of a modern analytics platform.
Designing for Humans, Not Just Screens
Before we built a single dashboard, we looked at the people behind the data. What does a Store Manager actually need to see at 8:00 AM? How does a Regional Manager spot margin erosion?
We didn’t just port old reports into a new tool; we redesigned the decision-making workflow. The new ecosystem provided:
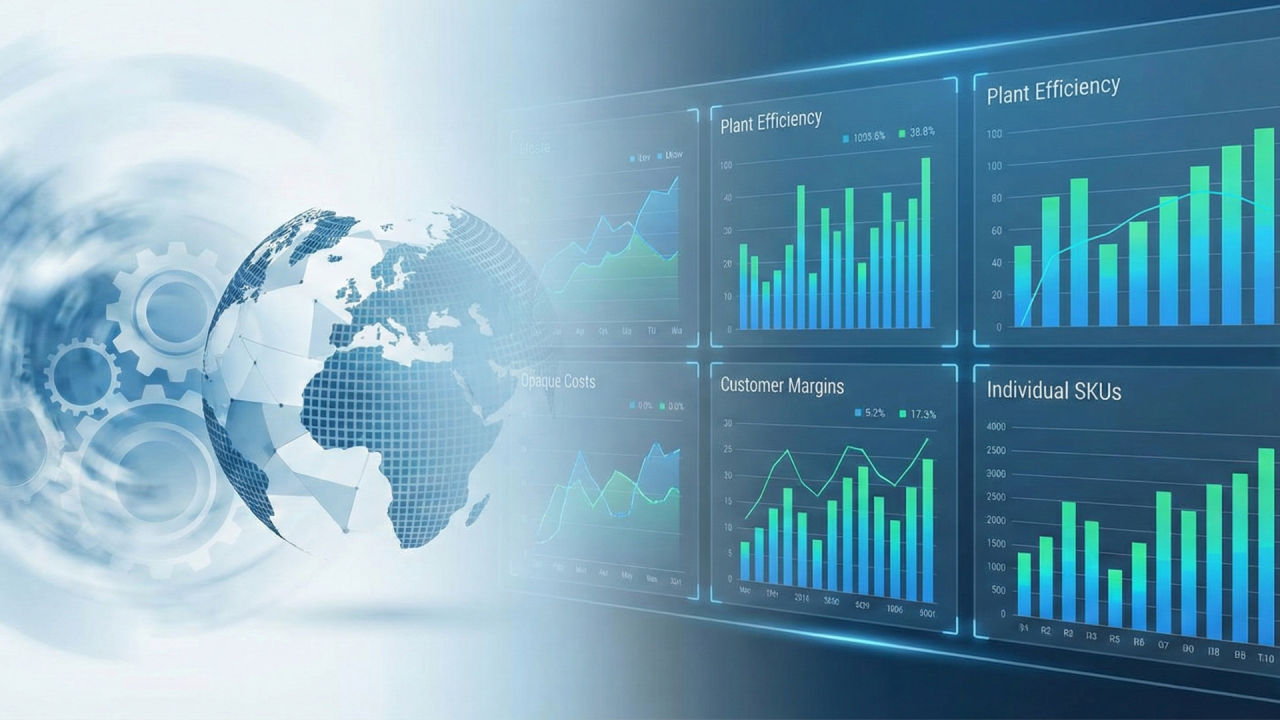
- Real-Time Visibility: Sales trends and margins are now monitored live rather than at month-end.
- Drill-Down Capability: Users can go from a high-level executive summary down to a specific transaction with a few clicks.
- Early Warning Systems: Underperforming stores or ineffective promotions trigger red flags immediately. This allows for course correction before the damage is done.
The Outcome: Escaping “Excel Hell”
This transformation delivered more than just prettier charts. It shifted the organization’s culture.
Teams are no longer bogged down by manual spreadsheet management, nor are they waiting in a queue for IT to generate a new report view. Instead of asking, “What happened last week?”, they are now asking, “What is happening right now, and how do we capitalize on it?”
The client’s Commercial Performance Lead summed it up best:
“We finally have immediate visibility into performance across stores and regions. Instead of waiting for reports, our teams can act on insights in real time.”
The Bottom Line: Data, on its own, is just noise. However, when you pair it with the right visualization and modern tools, it transforms from a burden into your sharpest competitive advantage.